A logistics facility can spend more on guards, cameras, access control, lighting, monitoring, and technology without knowing whether security is actually improving.
That is a measurement problem.
Security KPIs for logistics facilities are measurable indicators that show whether gate, yard, perimeter, incident-response, and access-control processes are reducing risk without creating unnecessary operational friction.
The best metrics do more than count incidents. They reveal whether the operation detects problems early, verifies exceptions consistently, responds quickly, keeps trucks moving, and creates usable records when something goes wrong.
Quick Answer: Which Security KPIs Should Logistics Facilities Track?
| KPI | What It Measures | Why It Matters |
|---|---|---|
| 1. Gate processing time | Time required to complete routine transactions | Shows operational friction |
| 2. Gate exception rate | Percentage of transactions outside normal workflow | Reveals process quality and risk |
| 3. Exception resolution time | Time to resolve unusual transactions | Measures response efficiency |
| 4. Driver verification failure rate | Driver identity or authorization mismatches | Highlights access risk |
| 5. Trailer mismatch rate | Expected vs. actual trailer discrepancies | Supports chain of custody |
| 6. After-hours exception rate | Unusual activity outside primary operating hours | Shows reduced-staffing exposure |
| 7. Perimeter alert verification rate | Percentage of alerts confirmed as meaningful | Measures alert quality |
| 8. Response time | Time from verified event to intervention | Measures action, not just detection |
| 9. Camera/system availability | Percentage of time critical systems are operational | Reveals coverage reliability |
| 10. Incident closure time | Time to document and close security incidents | Measures accountability |
| 11. Repeat exception rate | Recurring issues by carrier, customer, lane, or shift | Identifies root causes |
| 12. Security cost per transaction/site | Cost relative to activity or facility | Connects security to financial performance |
Why Security Metrics Matter More Than Security Activity
Many security reports focus on activity:
Number of patrols.
Number of cameras.
Number of alerts.
Number of guard hours.
Those numbers describe what the security program did.
They do not necessarily show whether it worked.
A facility may generate 5,000 alerts per month and still miss the one event that matters.
Another may have fewer alerts because its analytics are better tuned.
The goal is not maximum security activity. The goal is measurable control over risk and operational disruption.
1. Gate Processing Time
Gate processing time measures how long it takes to complete a normal inbound or outbound transaction.
Track at least:
- average processing time;
- median processing time;
- 90th percentile processing time;
- inbound vs. outbound time;
- peak-hour time;
- and time by transaction type.
Median and percentile measures matter because a simple average can hide a small number of very slow transactions.
Use this KPI to identify congestion, unnecessary manual steps, slow verification, or lanes that need workflow changes.
2. Gate Exception Rate
Exception rate is the percentage of transactions that do not follow the normal workflow.
Examples include driver mismatches, trailer mismatches, missing appointments, BOL discrepancies, seal exceptions, and changed pickup instructions.
A high exception rate does not automatically mean security is failing.
It may indicate poor upstream data, carrier behavior, customer-specific complexity, or weak integration between systems.
Read our gate exception management guide.
3. Exception Resolution Time
This measures how long it takes from the moment an exception is identified until the transaction is approved, denied, redirected, or otherwise resolved.
This KPI matters because secure exception handling can still become an operational problem if trucks sit in the primary lane for fifteen minutes while staff search for an approver.
Track resolution time by exception type.
A BOL discrepancy may require a different workflow from an unknown driver or a damaged seal.
4. Driver Verification Failure Rate
This metric tracks how often driver information fails to match the expected transaction.
It may include:
- unknown driver;
- expired credential;
- driver substitution;
- carrier mismatch;
- missing pickup authorization;
- or failed identity check.
The FBI recommends positive driver identification at pickup as part of cargo theft prevention.
Review the FBI’s cargo theft guidance.
A rising failure rate may justify reviewing carrier procedures, customer data quality, or fraud controls.
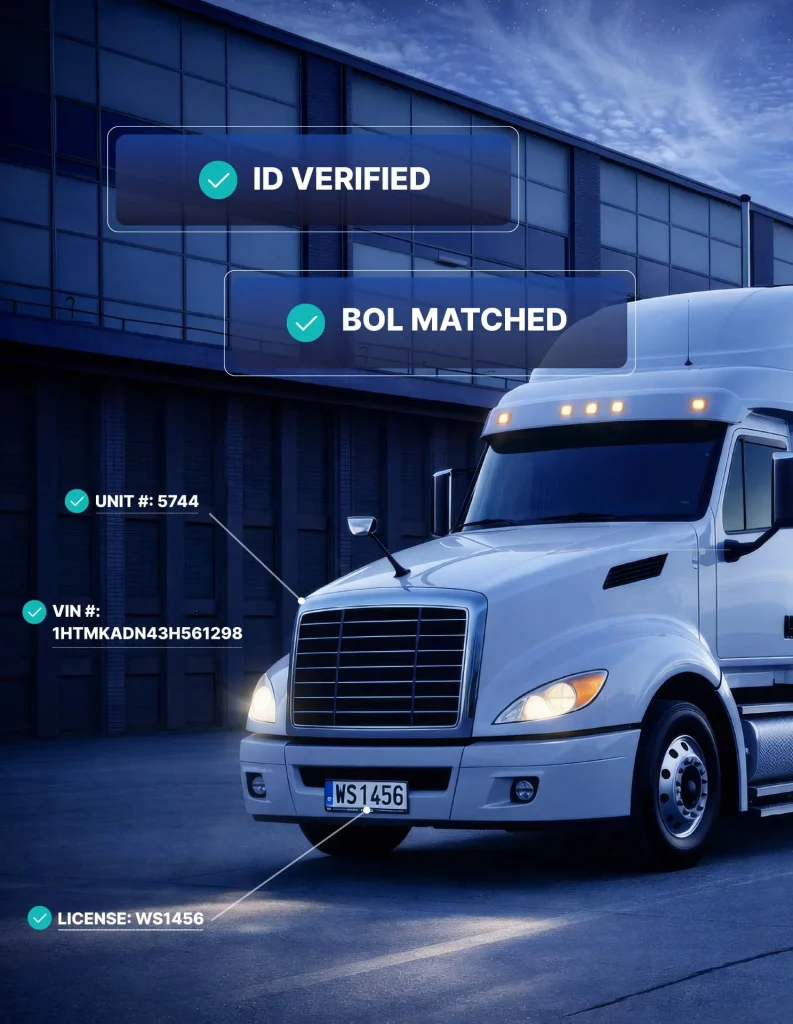
5. Trailer Mismatch Rate
Trailer mismatch rate measures how often the trailer presented at the gate differs from the trailer expected in the transaction.
Some substitutions are legitimate.
But this KPI is still valuable because trailer identity is an important part of chain of custody.
Track:
- total trailer mismatches;
- authorized substitutions;
- unexplained mismatches;
- repeat carriers with mismatches;
- and mismatches associated with outbound releases.
6. After-Hours Exception Rate
Facilities often operate differently at night, on weekends, and during holidays.
Management availability may be reduced. Fewer employees may be present. Loaded trailers may remain staged longer.
Track the percentage of after-hours transactions that generate exceptions and compare that with normal operating periods.
If the rate is materially higher, review whether after-hours procedures, staffing, verification paths, or carrier communication need improvement.
7. Perimeter Alert Verification Rate
Raw alert count is usually a poor KPI.
A better measure is how many alerts are verified as meaningful security events.
For example:
- total perimeter alerts;
- verified human activity;
- authorized activity;
- environmental/non-threat events;
- repeat nuisance sources;
- and alerts requiring intervention.
The objective is to improve signal quality, not simply produce more notifications.
8. Verified Event Response Time
Detection is only useful if the organization can act.
Measure the time between:
- event detection;
- human or system verification;
- decision to respond;
- and actual intervention.
Intervention may include Voice-Down™, remote communication, notifying site management, dispatching a guard, contacting law enforcement, or another approved response.
A long response time can turn good detection into poor prevention.
9. Camera and Security System Availability
A camera that is installed but offline does not provide coverage.
Track uptime for critical:
- gate cameras;
- license plate cameras;
- perimeter cameras;
- intercoms;
- kiosks;
- gate controllers;
- network connections;
- and monitoring systems.
Useful measures include overall availability, average time to detect an outage, and average time to restore service.
10. Incident Closure Time
Security incidents should not remain open indefinitely.
Measure the time from event creation to documented closure.
Closure may require:
- video review;
- transaction review;
- customer communication;
- police report;
- insurance documentation;
- corrective action;
- and management review.
A long closure time may indicate fragmented data or unclear ownership.
11. Repeat Exception Rate
This KPI asks whether the same problems keep happening.
Examples:
- one carrier repeatedly sends the wrong trailer;
- one customer generates missing appointment data;
- one shift has more seal exceptions;
- one gate experiences recurring equipment failures;
- or one perimeter zone produces repeated nuisance alarms.
Repeat exceptions are valuable because they point toward root causes that can often be corrected.
12. Security Cost per Transaction or Facility
Security spending should be connected to the operation it protects.
Depending on the organization, useful measures may include:
- security cost per gate transaction;
- security cost per facility;
- security cost per operating hour;
- guard cost per gate;
- remote monitoring cost per site;
- and annual cost by security layer.
This does not mean choosing the cheapest security model.
It means understanding whether cost is producing measurable control.
Read our guide to the true cost of security guards at logistics facilities.
Leading Indicators vs. Lagging Indicators
Security leaders should track both.
Lagging Indicators
These describe events that already happened:
- confirmed thefts;
- loss value;
- property damage;
- police responses;
- claims;
- and safety incidents.
Leading Indicators
These may reveal risk before a major loss:
- rising driver mismatch rate;
- increasing after-hours exceptions;
- camera outages;
- longer response times;
- repeat trailer mismatches;
- higher unresolved-alert volume;
- and growing exception resolution time.
A mature security dashboard should not wait for theft to prove that a control is weak.
How to Build a Logistics Security Dashboard
Start with a small number of metrics that leadership can understand.
For an executive dashboard, consider:
- total gate transactions;
- median gate processing time;
- exception rate;
- verified threat events;
- response time;
- system availability;
- confirmed incidents;
- and security cost.
Operational teams can drill deeper into driver mismatches, trailer mismatches, BOL exceptions, seal issues, and site-specific performance.
A dashboard becomes less useful when it contains thirty metrics without clear ownership.
Set Targets Carefully
Not every KPI should be driven toward zero.
A zero gate exception rate may mean the operation is perfectly clean.
It may also mean the system is not detecting mismatches.
A lower perimeter alert count may mean better tuning.
It may also mean a camera is offline.
Targets should consider the operating context and be reviewed alongside other indicators.
Benchmark Sites Against Comparable Sites
Multi-site organizations should compare similar facilities rather than ranking every location together.
An LTL terminal with constant trailer movement should not be benchmarked directly against a smaller manufacturing site with ten trucks per day.
Group sites by:
- facility type;
- transaction volume;
- yard size;
- operating hours;
- cargo profile;
- and security model.
Then look for meaningful outliers.
Use KPIs to Improve Operations, Not Just Security
Security data often reveals operational problems.
Long gate times may indicate scheduling issues.
High trailer mismatch rates may indicate dispatch data problems.
Frequent BOL exceptions may reveal documentation issues.
Repeated after-hours arrivals may show appointment planning problems.
The best security KPIs help operations and security improve together.
How Birdseye Supports Security Measurement
Birdseye helps create structured event and transaction data across gates, yards, and perimeters.
GATECORE supports gate workflow and exception records.
YARDCORE adds visibility into yard activity.
SAFECORE supports monitored perimeter events and verified response.
The Portal centralizes important facility records for review and reporting.
Monthly Security Review Questions
Every month, leadership should ask:
- Which security metric moved the most?
- Which facility is an outlier?
- Which exception type is increasing?
- Are response times improving?
- Which systems have the most downtime?
- Which carriers or customers generate repeat issues?
- Are we paying more without improving measurable outcomes?
- What corrective action was completed since the previous review?
These questions keep the dashboard connected to decisions.
Security KPI Implementation Checklist
- Choose a small executive KPI set.
- Define each metric precisely.
- Use the same definitions across sites.
- Separate routine activity from exceptions.
- Track both leading and lagging indicators.
- Assign an owner to every KPI.
- Set review cadence.
- Benchmark comparable facilities.
- Document corrective actions.
- Retire metrics that do not drive decisions.
Make Every KPI Actionable
A useful KPI should have three things attached to it: an owner, a target or acceptable range, and a defined response when performance moves outside that range.
For example, if camera availability drops below the approved threshold, someone should own the remediation. If exception resolution time rises for three consecutive weeks, the team should review staffing, escalation paths, or upstream data quality. If trailer mismatches rise for one carrier, transportation management should have a clear follow-up action.
A metric without an owner becomes a report. A metric tied to a decision becomes a management tool.
Frequently Asked Questions
What are the best security KPIs for a warehouse or logistics facility?
Useful KPIs include gate processing time, exception rate, driver and trailer mismatch rates, verified threat rate, response time, system availability, incident closure time, repeat exceptions, and security cost.
Should security teams measure the number of alerts?
Alert volume alone is not enough. Measure how many alerts are verified, how many require intervention, and how quickly the team responds.
How often should logistics security KPIs be reviewed?
Operational metrics may be reviewed daily or weekly, while executive trends are often reviewed monthly or quarterly depending on facility volume and risk.
How can security KPIs help reduce cost?
They can identify inefficient guard deployment, repeated manual exceptions, unnecessary alert volume, downtime, and process friction that increase operating cost without improving security.
What is the difference between a leading and lagging security indicator?
Lagging indicators measure outcomes that already happened, such as thefts or claims. Leading indicators reveal developing risk, such as rising mismatches, slower response, or system downtime.
Final Takeaway
Security becomes easier to manage when it becomes measurable.
The objective is not to create a dashboard full of numbers.
It is to answer practical questions:
Are gates getting faster without becoming less secure?
Are exceptions increasing?
Are alerts meaningful?
Can the team respond quickly?
Are systems available when needed?
Are security costs producing better outcomes?
Track the metrics that connect risk, response, operations, and cost—and use them to improve the facility every month.